This project tries to develop an analysis of the data recorded by my Fitbit Charge 2 band for 30 months. The project has been divided into 2 phases from the extract of the data and analysis.
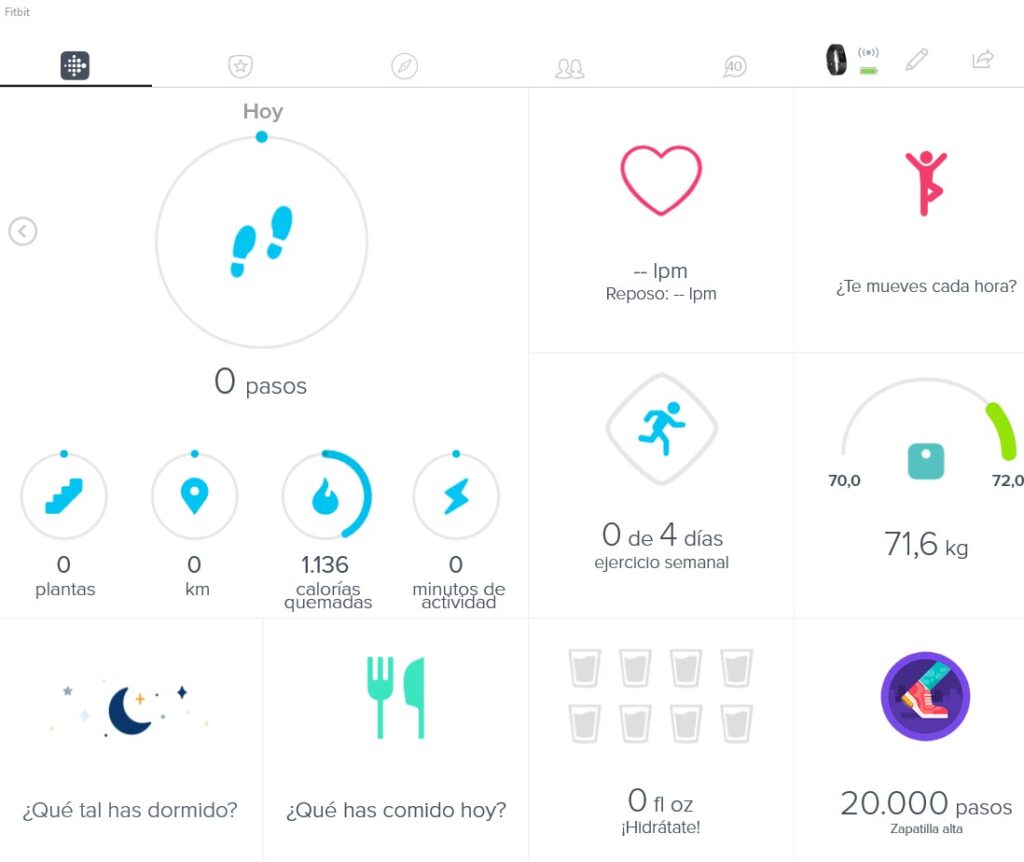
The activity data recorded by Fitbit bands can be accessed through a Web API for accessing data from Fitbit activity trackers. To access, you need to be registered in the Fitbit web app and have your device connected where the data will be progressively stored. Activity data can also be accessed visually through the Fitbit app where the most important metrics will be presented.
Also from the Fitbit user you can download the data per month in CSV format, which could also serve us for this purpose. However, in this case for its greater flexibility, I have downloaded the data through the web API for what it is necessary to register and register a new application and implement an OAuth 2.0 authorization flow to allow people to give your app permission to access data on their behalf.
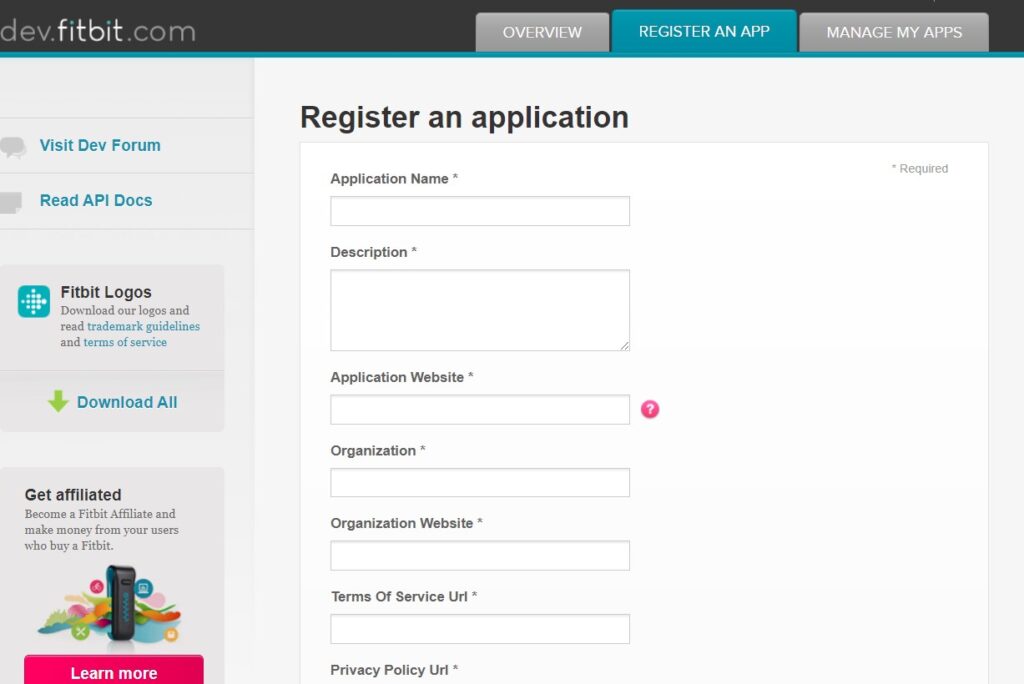
Fitbit uses OAuth 2.0 for user authorization and API authentication. The OAuth 2.0 framework requires your application to obtain your own Access Token when the Fitbit user authorizes your app to access their data. The Access Token is used for making HTTPS requests to the Fitbit API.
There are also some libraries in Python that can help simplify the process such as python-fitbit by Orcas but I prefer the flexibility of the request method…
Once we have the Access token, we get to work…
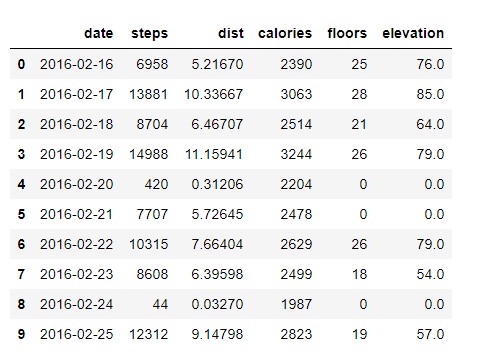
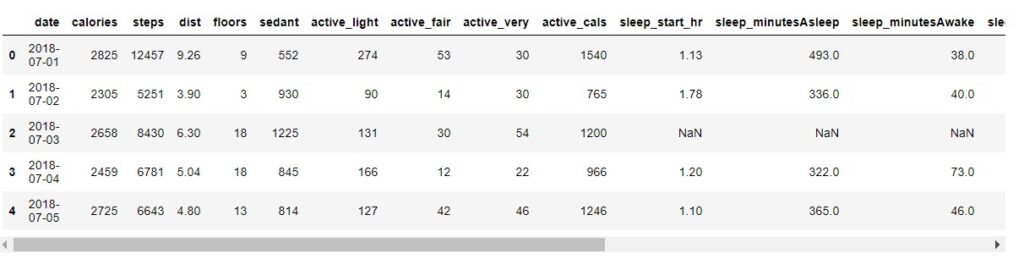
We have to perform some processes to clean and format conversion, especially the date to convert them into DateTime type in pandas.
I perform the same separate extraction of the sleep data from making request just like the extraction of physical activity but with the following url: https://api.fitbit.com/1.2/user/[user-id]/sleep/date/[date].json
All data options for extracting oversleep are available in Fitbit documentation that can be viewed from: https://dev.fitbit.com/build/reference/web-api/sleep/
Once the physical activity and sleep data have been extracted and the different types of data converted to Nan null values, we join the different df generated to work in a unified way from the common variable ‘date’.
(You can view the details of data processing on the project website on Github)
Analysis of data collected🔍
We do a provisional exploration of the features.
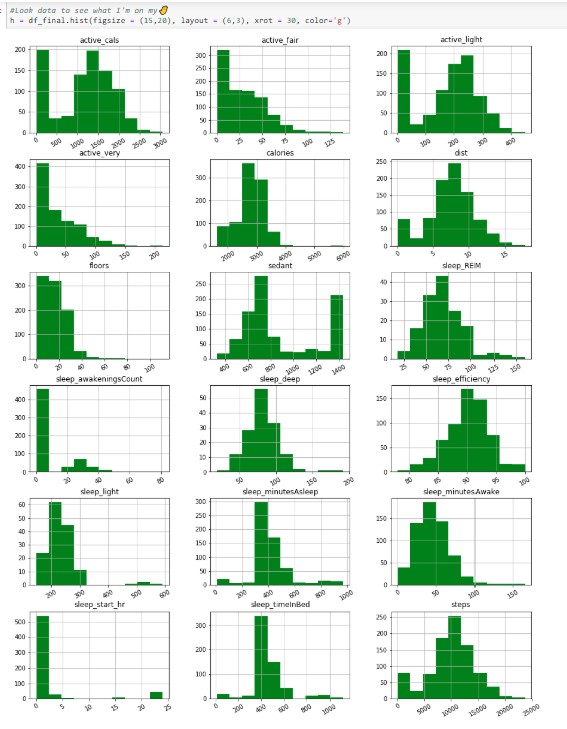
Based on these data histograms, some preliminary ideas can be:
- Most of the days of medium or high activity show normal logarithmic or exponential distributions, while days with sedentary and slightly active show a distribution similar to normal.
- The average sedentary activity is about 10 hours but considering that many values of 1440 minutes that corresponds to 1 day are shown, I think that those days I did not have the band.
- The efficiency of my sleep is generally high (> 85%)
- On average, I sleep about 300-400 min (5-6,6 hours) of sleep each night.
- The data show that I am an average of about 40 minutes awake during sleep, that the truth is a higher figure than I would have thought. It assumes about 10% of the hours of sleep that from what I have looked at is more or less in the average of the population (I´m more relaxing!!)
- And although I unveil I stay in bed (average about 400 min)😏
- I get rid of quite a few times at night although I have a high number of 0 times awakened, which gives me the feeling that they are missing values. I’ll have to check and verify that null values don’t influence the final result.
- I walk an average of between 8,000-10,000 steps a day, which I find to be a little higher than the population average: http://journals.lww.com/acsm-msse/Abstract/2010/10000/Pedometer_Measured_Physical_Activity_and_Health.4.aspx
Having seen this initial data exploration, we will deal with some inconsistencies. We can note that the activity is ‘0’ when the band hasn`t been used so are missing values.
En the case of ‘sedant’: Minutes of zero activity, when it is 1440 x 1day, means that the bands have not been used so en reality are also missing values. So change that value from1440 to value ‘nan’
According to the preliminary plots, a high percentage of the value ‘0’ can also be observed in variables that should have some number (even if it is minimal), if the bracelet accounted for any activity, indicating that they are also missing values. I also change those ‘0’ to ‘Nan’ values.
With this data cleaning, I have managed to homogenize the inconsistencies of the charts in which they appeared as an activity, records in which it is not expected to use the band.
Our analysis will depend to a large extent on temporal variables, activity per day or per week, hours of sleep per day, etc. So from the existing variables, we generate other new temporal variables about the details of the week and month in the records.
Analyze in more detail the time of sleeping and waking up.
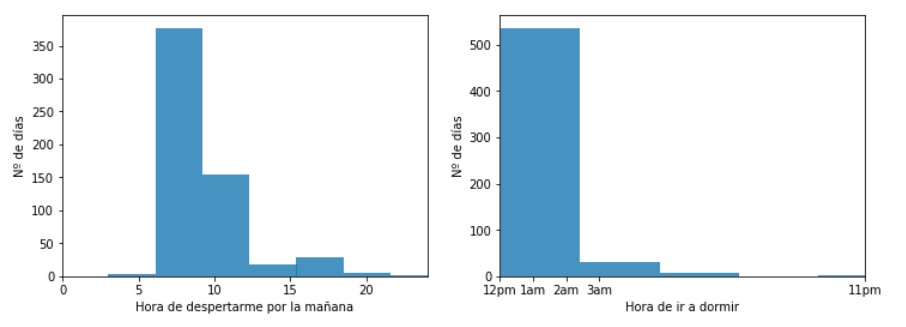
As you can appreciate I’m not especially early, I guess because I’m rather nocturnal and I usually go to bed late🙄
We measure the evolution of sleep hours per month in these nearly 3 years of measurement.
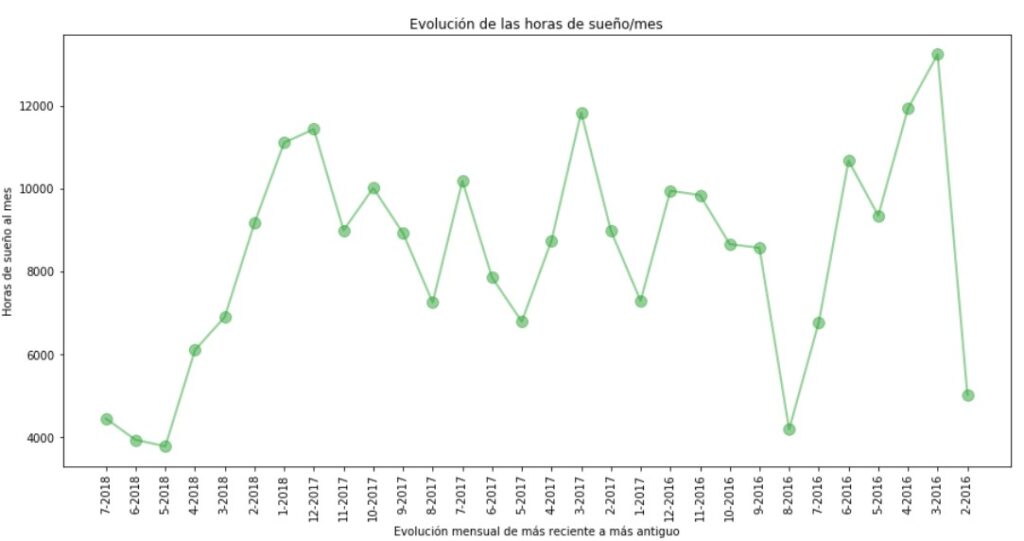
I was hoping to find a clearer pattern of hours of sleep😴. There is usually a decrease in sleep hours in summers, but in 2017 I can´t see that pattern.
Now we try to explore variations based on days of the week 📅. We extract a series of pooled data that facilitates the aggregated analysis by weeks and According to these new parameters grouped by day of the week, I view them on graphics 📉.
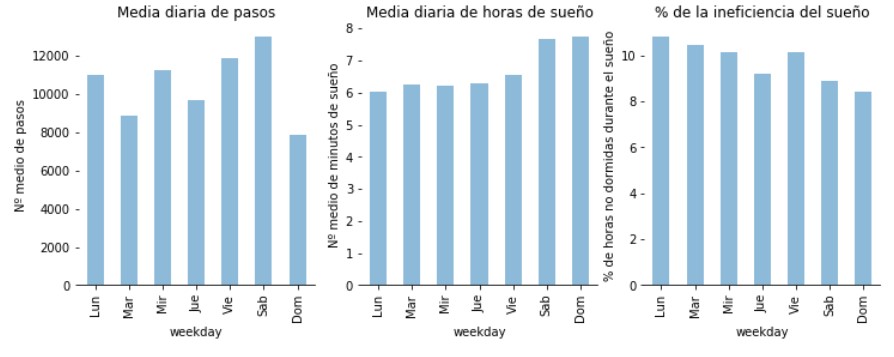
Some conclusios:
- The average of steps is close to 10,000 steps🏃, although Mondays, Wednesdays, Fridays and Saturdays are above and being in an upward progression. It coincides with the days I do sport (gym and football on Saturdays), so it makes sense.👏👏
- As expected on weekends I sleep two more hours on average. I don´t the goal expected about 8 hours of sleep daily.😴
- I’m gaining sleep efficiency as the week progresses. Monday is the least efficient day🙈.
Observing bedtime, we can analyze how much time and sleep efficiency per week.
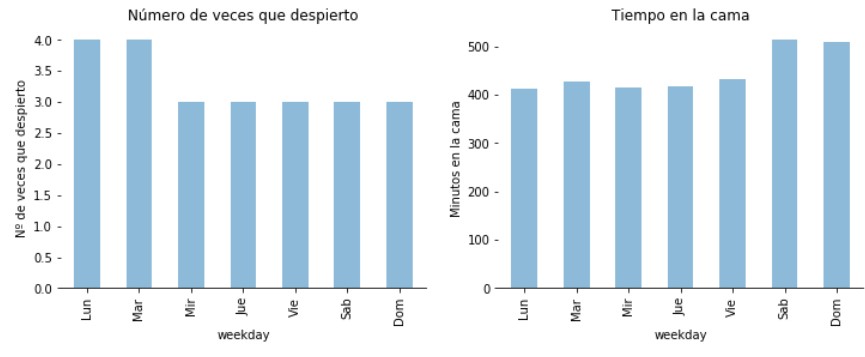
Some conclusions:
- In keeping with the charts and data above, what Monday and Tuesday are the days I wake up most times.
- It’s not a great revelation, they won´t give me the novel prize for this🥇, but the weekend I can take more in bed😯.
Another analysis we can do is the distribution of the number of times I wake up, the inefficiency of sleep, distribution of bedtime and wake-up time.
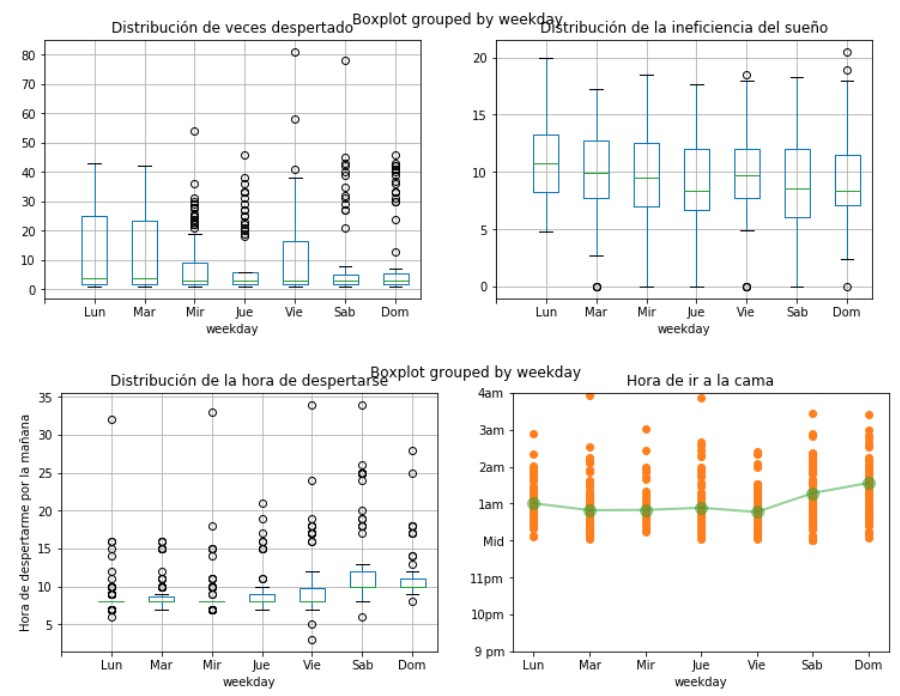
Some conclusions:
- Although the average number of times I wake up is around 3 or 4 times, but there is a high variability especially on Mondays, Tuesdays and Fridays. Sometimes I get woken up more than 20 times😫.
- The distribution of sleep inefficiency follows the more regular distribution.
- In general, the time of awakening is always concentrated between 7 and 10 am.
- Time to go to bed is always very close to 1 am.
Some other observations:
- On average, I wake up between 7 and 8 a.m. on weekdays and get to bed on weekends until 10 am.
- I usually sleep on the 1 am, which surprises me because at 12-12:30 I usually go to bed, but it is true that there is always something to read or watch on Netflix.
- The inefficiency of my sleep (minutes awake in front of bedtime) is greater on Mondays and Tuesdays, which is curious but possibly explainable because I come from sleeping more on the weekend and can be more uneasy about the start of the workweek. What is more curious is that Fridays are also one of the most inefficient in this regard.
- There seems to be a lot of variability in the times I wake up at night. The average is 3-4 but there are times that reach 20 times. It can be a response to times of special nerves or maybe that I have two young children and sometimes they are bad.
You can see some more detailed analysis of physical activity on the project’s web on Github.