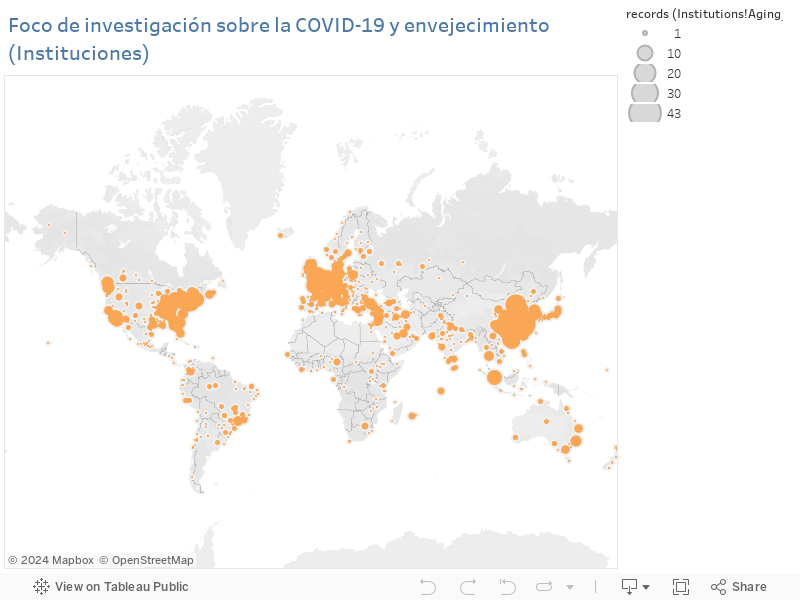
For a recent post I wrote about the state of R&D on COVID-19 and its impact on ageing, one of the aspects that were considered in data analysis was the display on a world map of COVID-19 research focus. So the institutions or research centres that have developed the greatest scientific production since the pandemic began in 2020 were on the map. This data was provided by the Web of Science (WoS), which among other data provides the name of the Institutions or Organizations from which the scientific articles come. To locate each of these research institutions (in this case there were more than 6,300 names in the query) and to obtain their geographical points and be able to position them on a map, it was necessary to develop a geocoding methodology in Python. Most commonly in these cases is to use the Google Maps API to get the coordinates (latitude and longitude) from a name or address. However, Google limits free queries to about 1,000 so you had to find an alternative that didn’t have that restriction.
After testing different libraries, I prefer to choice geopy that has different geocoders and is quite flexible for use and programming. From here, a function is developed to automate queries and move to the dataset with the names of the different Institutions from which to get the coordinates into two new added variables (Latitude and Longitude). From that data we can represent them in a world map, in my case I did it with Tableau but it could also be done with Folium, Ploty, etc.
The main ideas you can extract from this post can be:
- Geocoding basic concepts
- Use of the geopy library and its integration with pandas
- Use of the different free geocoders, focusing mainly on two examples with and without the use of apikeys.
- Advantages and disadvantages of using these free alternatives with this example.
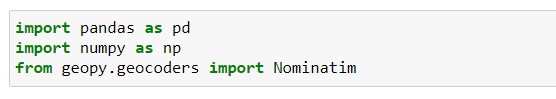
First of all, we install the necessary libraries and their dependencies.
We will use the geopy library and the Nominatim geocoder because it´s Open Source and without query limitation, therefore it is one of the most versatile for a significant number of queries and without the restrictions of other APIs. Nominatim uses OpenStreetMap data to search for locations on Earth by name and address (geocoding). You can also do the opposite (reverse geocoding), find an address for any location on the planet from its coordinates.
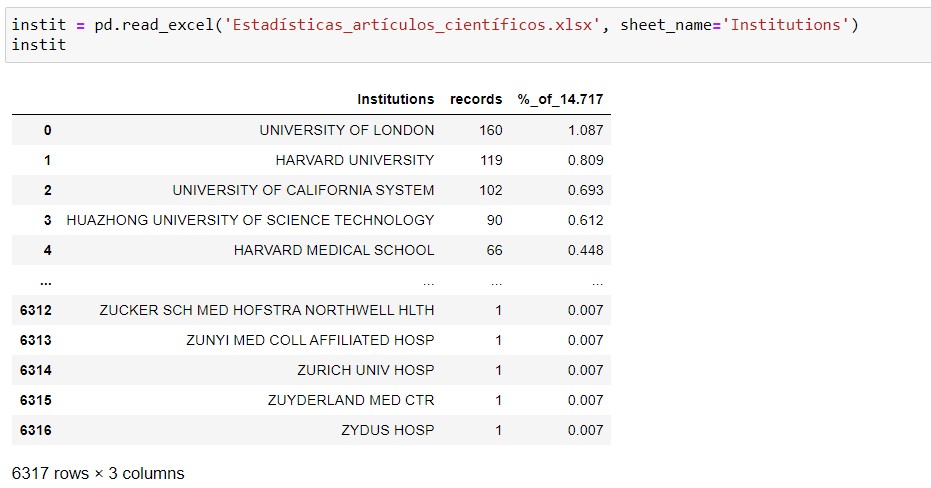
We call the Excel file where we have data from the 6,317 Institutions that are researching COVID-19:
Now we generate a list of the names of the institutions and test how it works with one of the elements to verify that the library is working properly.
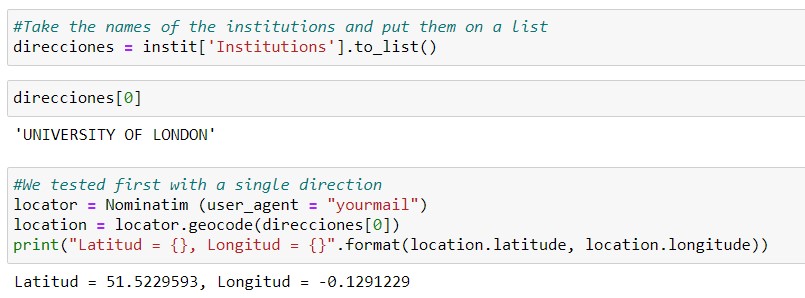
Perfect, it seems that it provides us with the coordinate data correctly when entering the string of one of the Institutions. Mention that it is important to define the parameter “user_agent” that defines the name of the personal application or the easiest thing is to put an email that will serve to notify in case of a failure or problem in the queries.
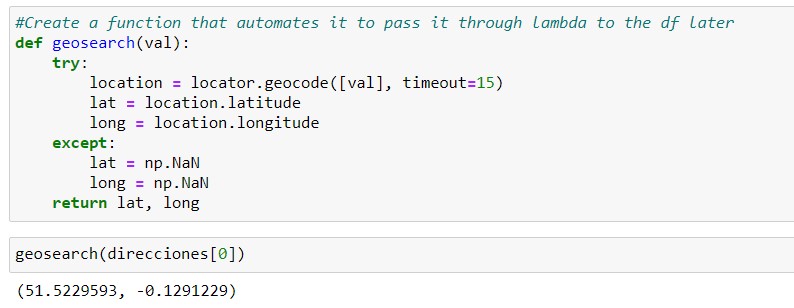
Now we automate the process with a function to move to the dataset and search for all Institution names. At this point, it should be borne in mind that it will be necessary to introduce some exception in the case that the Institution name doesn’t find by name and therefore there aren´t coordinates since it is common for data provided by scientific repositories such as the WoS to define the same institution with different names or descriptions sometimes difficult to interpret. Therefore, we developed the function and tested with the same record above to verify that it works properly. We have entered a “timeout” parameter to ensure that connections are not blocked. Maybe 5 seconds or less is enough.
Once the function is verified to produce the expected result with the sample record, we apply it to the dataset using a lambda function and generate a new «coord» variable.

We check the effectiveness of the search and verify that it is approximately 50% of the list of Institutions. In our case, it´s sufficient, because it finds many of the results of the first of the list that are the ones that develop the most research production (number of research articles), so they are the ones that interest us the most to visualize in a world map and get an idea of the main research focuses. But if we want to go a little further to complete the list and here, in order to see other geocoders, let’s try others with free access, that use apikeys and with a high number of queries allowed. In our case we have chosen Yandex («the Russian Google»), a platform with multiple services that in my case I have tested for other APIs and works quite well as a substitute for the limitations of Google APIs. For more information on available geocoders and their features, you can consult this link.
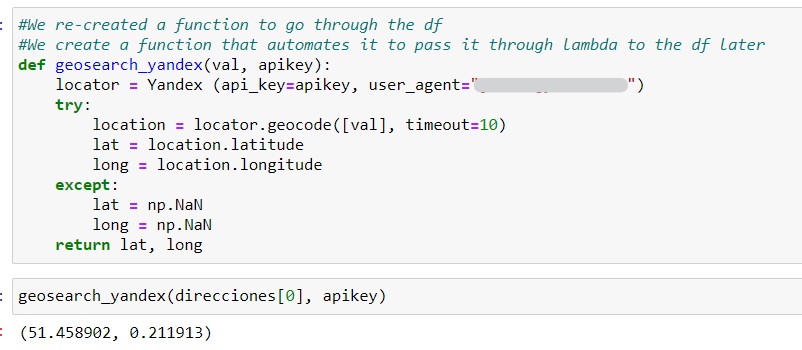
In this case, you have to register with Yandex to get an apikey with which you can make queries up to 25,000 per day (enough for our case). Once we have verified that our feature works correctly, we apply it to records that have not been found with Nominatim. To do this, we select a subdataset with the field coordinates with null values.

In total, 65% of the available recordset coordinates are achieved. Testing with some other geocoders we could maybe get some more performance.
We need for our visualization applications (in this case Tableau public) to have two distinct fields like Latitude and Longitude, so we have to separate the «coord» field into two variables within the dataset.
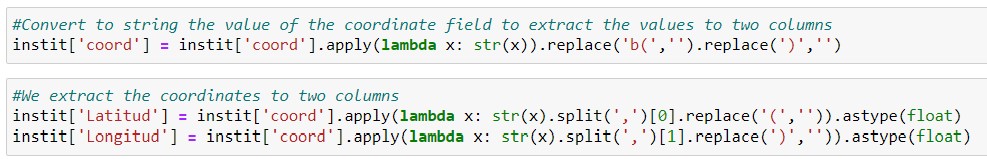
Finally, we would do the same with the subdataset insti_nan.
The advantages of using this type of geocoders are wide because of the great flexibility of programming and free queries number, perhaps the disadvantage lies in the lower reliability in the search of coordinates when it comes to names of institutions or addresses that are not perfectly defined, so their use could be intended for pre-production projects and improve the reliability of searches or projects that need to be put into production would have to go to payment tools more reliable, but it can certainly serve as an approximation to the optimal solution.
The final result is displayed as follows:
I hope that this little tutorial can help you get an idea of how easy it´s to use geocoders and their diversity of options. For some extra details, you can check the project notebook in my GitHub repository.