
When I face the challenge of building prediction models in my different projects or in the data science challenges (Kaggle, Datathon, etc.), I always face a laborious and scrupulous trial and error to discover the best model and optimize its performance.
Often experience or intuition, lead you to choose an algorithm or set of models that could better adapt to the kind of data you work with, but you have no choice but to compare it with other algorithms to verify that your hypothesis is correct before moving on to the optimization phase of the chosen model. Of Course, the complete previous phase of choosing the best variables, reducing dimensionality or delete multi-collinearity, etc., entails a programming time from which you cannot escape if you want to be rigorous to detect the best possible algorithm for that dataset. This is further complicated when the deadlines are very tight either by collaborating with other workgroups on which your work depends or simply because you are participating in a Datathon in which you have a limited time to give the first results.
Recently I´ve been exploring the concept of AutoML (Automatic selection of Machine Learning-ML- algorithms, features and hyperparameters), I recognize that with a little suspicion, because many sell it as the end of data scientists, but after testing various options and libraries, for me it has been an essential tool to optimize my ML workflow time and minimize the deadlines of putting into production, with much less heavy work and manual adjustments, drastically reducing the time required to reach the optimization stage of the model.
On this way, I stumbled upon the PyCaret library that has become part of my kits of APIs indispensable to approach the problem and that implements optimization of variables and a comparison between models with very little code, having in a few minutes an approximate idea of which models and hyperparameters will behave best in the face of that data so that your time can be spent experimenting by focusing between two or three models.
As there is more than enough documentation to work with the PyCaret library, I will set out here a case of practical use that I have made so that you can see its usefulness, so let’s get started.
I recently enrolled in a Datathon organized by the Immune Technology Institute on a challenge for early detection of cardiac arrhythmias using Automatic External Defibrillators (DEA) that had to be solved between different teams and throughout that afternoon. Finally, I couldn’t attend, but I tried to reproduce the challenge asynchronously and compare the result with the winners. The challenge between the teams was to obtain a balanced error rate (BER) as low as possible, taking into account the fewest variables, for this purpose two sets of data were provided, one with which to work and the other with which to compare the developed model and finally calculate the BER. The fundamental problem with this dataset is that they are unbalanced so the standard classification algorithms are sessed to the majority class, which compromises their performance. In this case, the undersampling or oversampling strategy to balance the data was not necessary as the models between the teams were evaluated by the BER metric that is defined as a balance between Sensitivity (Se) and Specialty (Sp) and therefore takes into account that imbalance, which is key metrics in medical diagnostic environments.
That said, the strategy was to have a quick approximation of the algorithms that perform best in the F1 metric and how much dimensionality could be reduced for good performance. At this point, PyCaret provides a very effective tool, providing the most predictive variables and comparing metrics among the most popular binary classification algorithms, giving you a ranking to focus on with very few lines of code.
We have a Dataset with 30 variables and a binary target variable VF (0: Healthy, 1: Ventricular Fibrillation).

As you can see this dataset is very unbalanced.
The first step is to configure the environment for PyCaret, defining the Dataset and target variable and adding some settings to minimize the selection of variables.
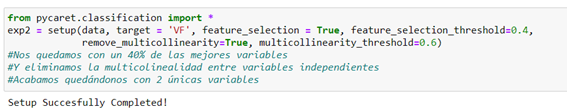
To do this, 4 arguments have been added: the selection of features in True, the threshold used for feature selection, the lower, the fewer features selected, and secondly the elimination of the multicollinearity and its threshold.
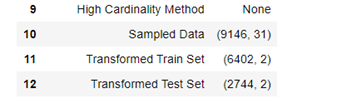
Simply with this configuration and in a few seconds, we manage to select the 2 most predictor variables and directly get the sub dataset with those two variables prepared to apply the comparison of algorithms that we will develop simply with the following code:
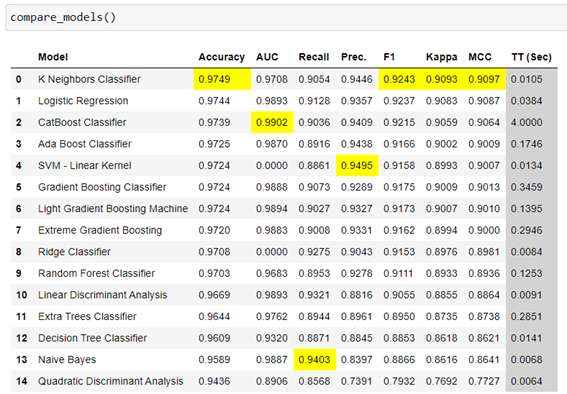
So far we have only spent about 10 minutes to reduce to a dataset of two variables that identify which Electrocardiogram parameters are most important for the detection of Ventricular Fibrillation and which is capable of obtaining an AUC performance of 97%. In this case, being a very unbalanced Dataset we have looked at the F1 metric, which in this case produces the same results in the ranking of the best models.
Just by making a quick comparison, I´ve made the normal workflow to reduce the dimensionality of the same Dataset using the typical techniques of Preliminary Data Analysis, Variance Inflation Factor (VIF), Elimination of characteristics with a low variance -VarianceThreshold- and finally a unique selection of the best features -SelectKBest-, being able to reduce to 5 main characteristics, which has taken me about 30-40 minutes. In my case, it can be said that PyCaret has helped me optimize this time by making a quick approach to the problem and being able to focus on the optimization of the model.
To try to meet the Datathon requirements, let’s run the model within PyCaret itself and see how it behaves with respect to the Datathon winners.
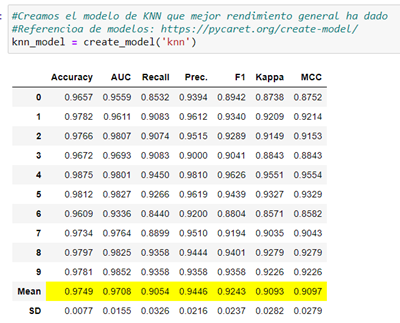
We create the model simply with «create_model»:
We try to improve the choice of hyperparameters to optimize performance with «tune_model()»:
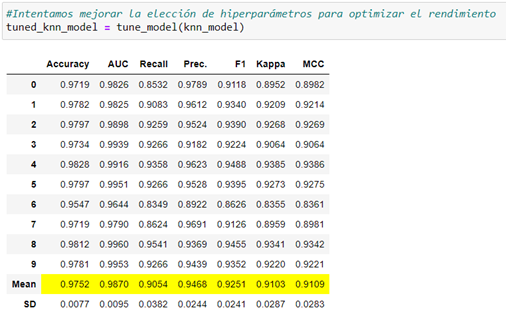
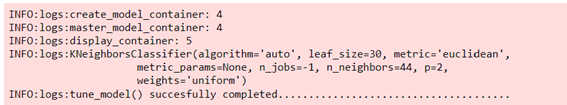
We got minimal improvement. PyCaret informs us which hyperparameters you have chosen for optimization:
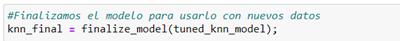
We finish the model for use with new data:
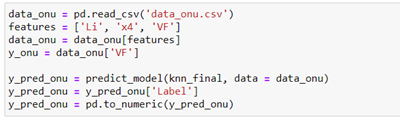
This way we can apply new data to it and get the prediction.
To verify that the same results are obtained we apply it in a traditional way with the Sklearn library and directly choosing the Knn algorithm that we have obtained as the best performance in the PyCaret ranking:
I pre-select training and test data in the same proportions that PyCaret 70/30 does.

And I generate the model with the hyperparameters chosen by PyCaret optimization:
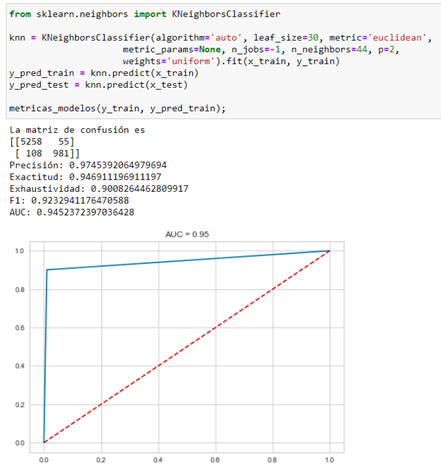
In this case, I get a performance somewhat lower than that predicted by PyCaret but valid to verify that it has good performance.
Finally, I calculate the BER to compare it with other models of the Datathon competition:
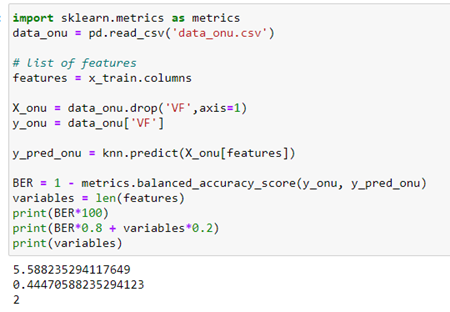
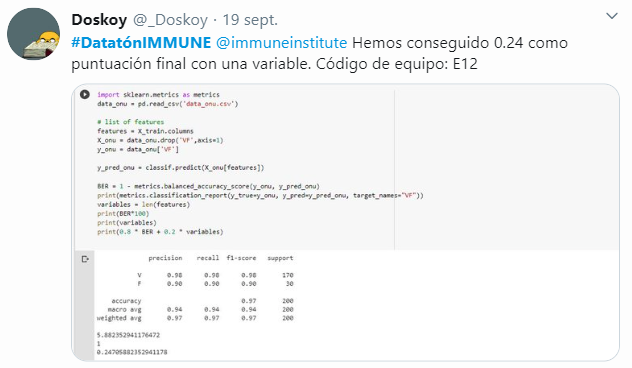
Posted on Twitter the winners were a group that selected a variable with a BER of 5.88. Using this fast approach method we have obtained 2 variables with a BER a little less than 5.58.

Conclusions:
- Automated machine learning (AutoML) can be a valuable tool even for experienced Data Scientist by offering well-designed pipelines that handle data preprocessing, feature selection, and quick model creation and evaluation and few lines of code.
- AutoML I see it as an efficient approach to the problem and, contrary to what might seem, it is necessary to have some knowledge to correctly interpret the results offered.
- The PyCaret library can be one of that useful AutoML with an easy learning curve and with good support and tutorials to learn it.
You can check the project Notebooks on Github