
The Beta in the financial area can be considered as an indicator that is used to estimate the volatility of an asset, compared to the behaviour of another group of stocks or assets. The Beta compares the oscillations that may have recorded a stock value relative to those of another asset. Typically, the behaviour of a stock is related to that of the index to which it belongs, so that a beta value greater than 1 means that stock yields amplify market returns both up and down. Conversely, a beta value of less than 1 means that stock yields are moderate compared to market returns. It is very important to understand that beta is a relative measure of risk and not an absolute measure. That means we could only measure how much risk an asset is to the reference market. If the stock market itself is overheated and volatile, then a beta of 1 means that the stock is equally volatile and with the same level of risk as to the market itself.
Taking advantage of an article published in this blog on the different ways to obtain the econometric data of the stock markets from the Yahoo Finance platform, and analyzing each of the variables that can be obtained, I wanted to go a little deeper and analyze how these variables are obtained and calculated. I stop on one of the data provided from these financial platforms, such as the Beta as an interesting indicator to have a first approximation to assess risk or a way to measure uncertainty in the outcome of an investment.
But in this case from the data that can be scraped from Yahoo Finance, you get the measurement of Beta in a 5-year time series. But what if we want to get a Beta in another time window other than that provided to be able to do some kind of analysis of the evolution of this indicator and thereby make some assessment of whether the shares of a company have increased or decreased its volatility and thus have a proxy on the valuation of investment risk, using the concept of trust in «The Wisdom of Crowds», that is, in the coming days the market would become more volatile if there was more risk in a company or would become less volatile if there was less risk. Therefore, by comparing the Beta supplied by Yahoo Finance with the Beta calculated for a previous timeframe, we could have an idea of how the volatility of that asset has evolved against its benchmark and therefore we could have a first approximation on investment risk, of course in a very simplified way. Therefore, in this post you can get the following information:
- Have the methodology to calculate the Beta in a time window customized to our interests that could be useful to evaluate, among many other indicators, the risk of our investment in a portfolio of securities.
- Extract data from Yahoo Finances with the pandas_datareader
- How to factor the formula to apply to a set of companies gathered in a dataset with pandas
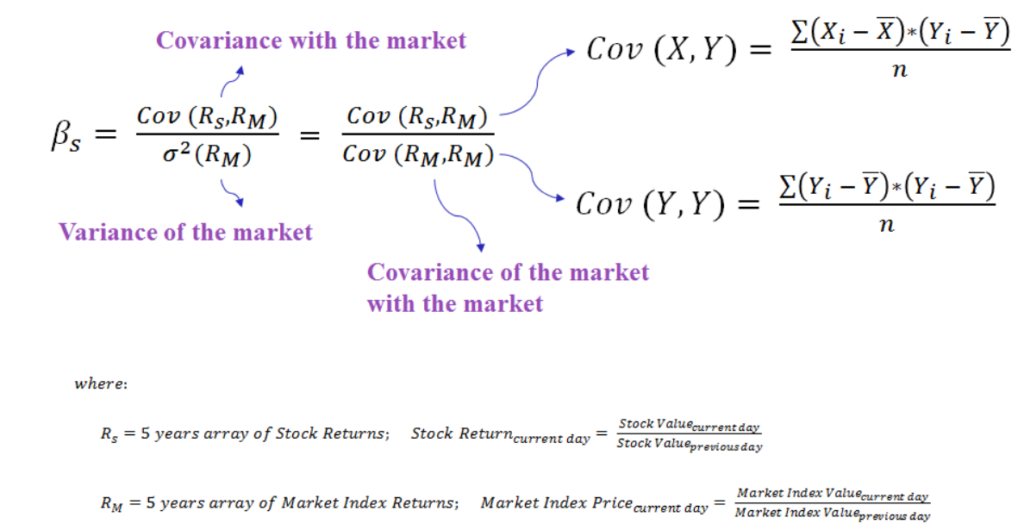
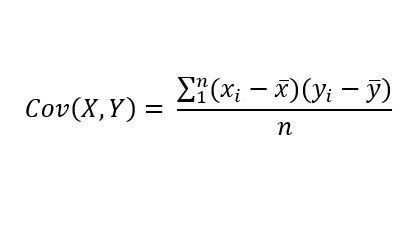
So, we get to work with a practical example to see how we can calculate the Beta for a given asset. The beta is calculated as a ratio between the standard deviation of an asset and the standard deviation of the reference index multiplied by the correlation between the action and the reference index:
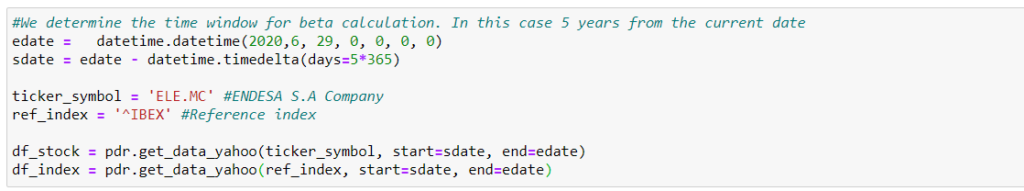
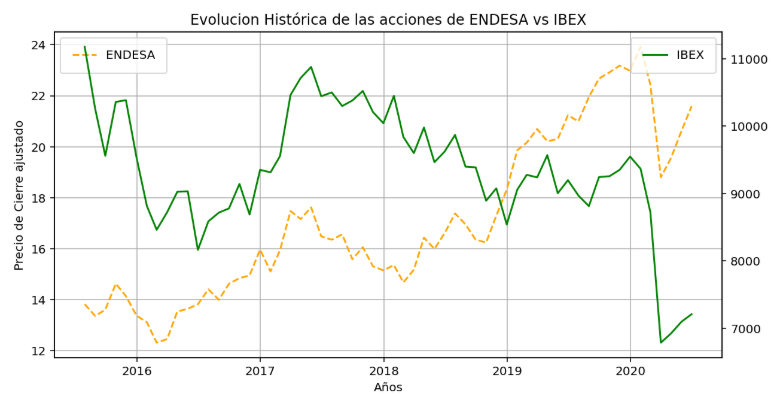
To apply it in a practical way with Python, we take as reference this post in which commented some scraping methodologies to obtain data from Yahoo Finance. We can get the economic data of a certain company, in this case, we stop at the Spanish IBEX35 and choose in the example the company ENDESA that is referenced with the ticker «ELE. MC.» We use it for the collection of the opening and closing prices of the shares with the pandas_datareader library. For what we determine the end of the share price data collection date to date (29/06/2020) and the start of the 5-year time series, subtracting those 5 years in days from the final date initially set.
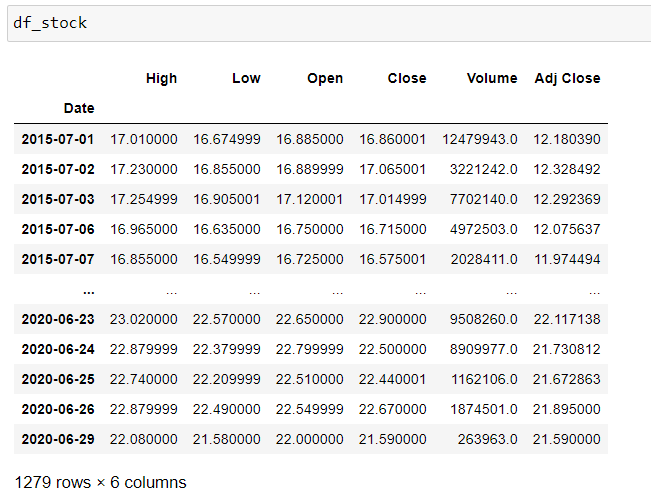
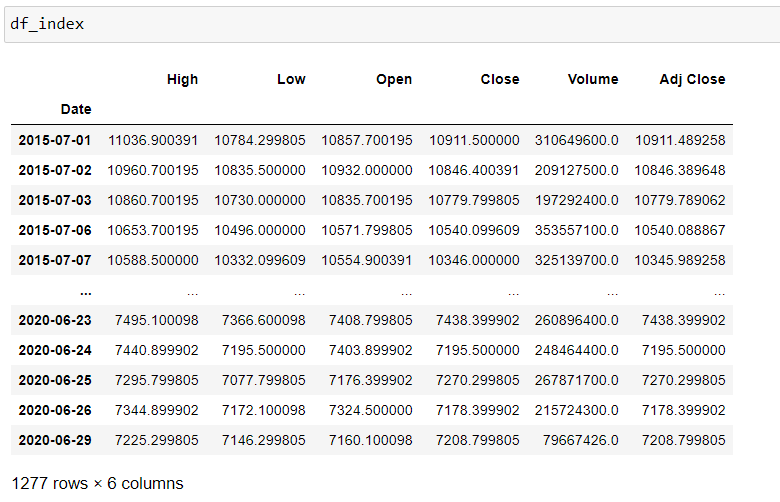
In this way, we get the price datasets of the stock history in the 5-year time window and its equivalent in the reference index, in this case in the Ibex in that same time window.
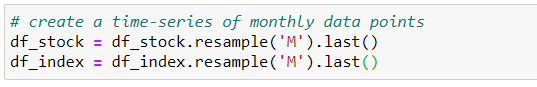
In order to calculate Beta in the way Yahoo Finance does, we need to resample the data to get monthly prices in a monthly time series, reunifying from daily prices. We achieve this with the panda resample() method. We tell him to group it on a monthly basis (‘M’) and we keep the last value of each monthly series with .last().
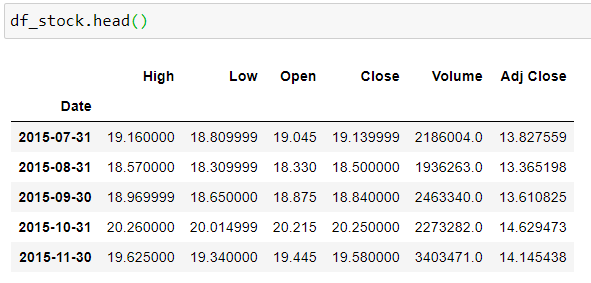
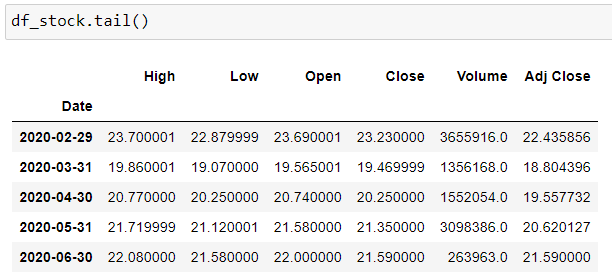
We look at how the dataset has been resized, seeing that each row corresponds to one month of the year.
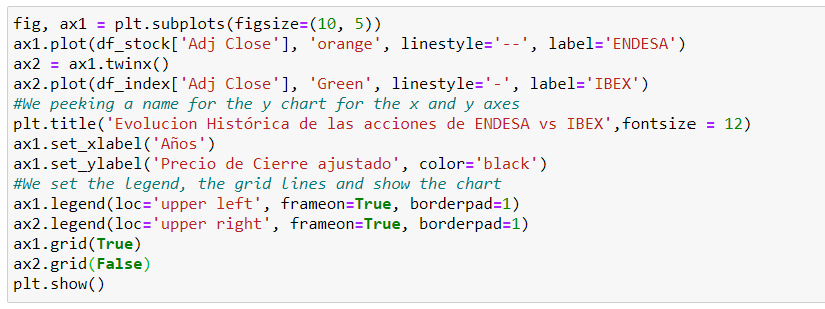
We visualize what the monthly time series looks like for both the company’s stocks and the benchmark.
A common operation in time series data is to calculate the returns by moving the values back and forth over time, in Pandas we can use the shift() method. We then calculate the percentage change of variation of each month in the time series and generate the new variables as returns. Finally, we add those two variables to a new dataset (df).
We factor in a function the covariance to automate the calculation of the Beta.
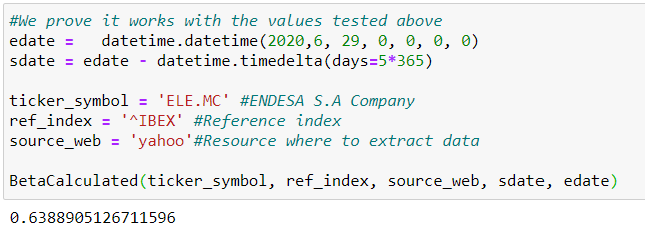
And we calculate the Beta (5 years per month) for the company ENDESA as of 29/06/2020.
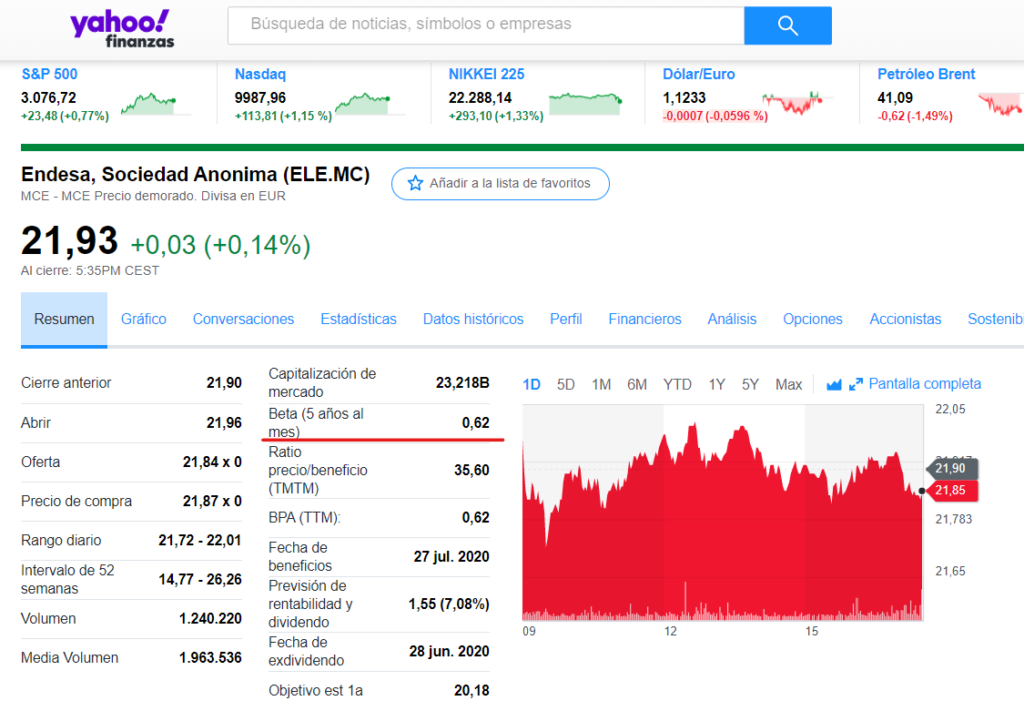
As a result, we get a Beta of 0.63 that indicates low volatility against the IBEX35 market, with moderate losses to the market decline.

We verify that the result is consistent with that provided by Yahoo Finance for this company.
One of the most interesting options in Pandas is that if we factor all this development, we can apply it to a company dataset and calculate Betas very quickly in a personalized way.
And we apply it on the same dates and company as the initial calculation to verify that it works correctly.
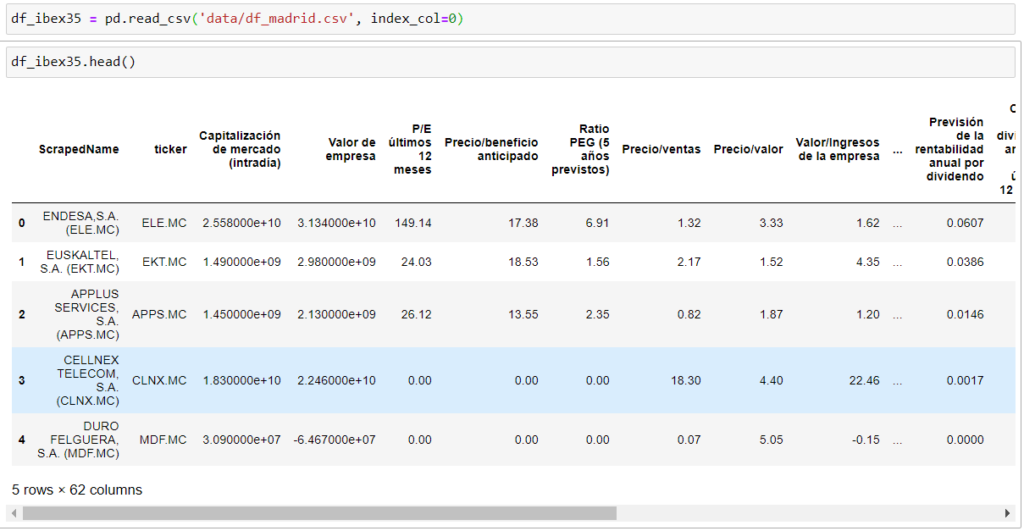
Now if we have a data frame with the tickers from different companies, we can calculate the Betas of each of them in a custom time series. For example, if we take the scraped data frame of yahoo, which we extracted in the already mentioned post above, in which the economic data of the companies that form the ibex35 were obtained.
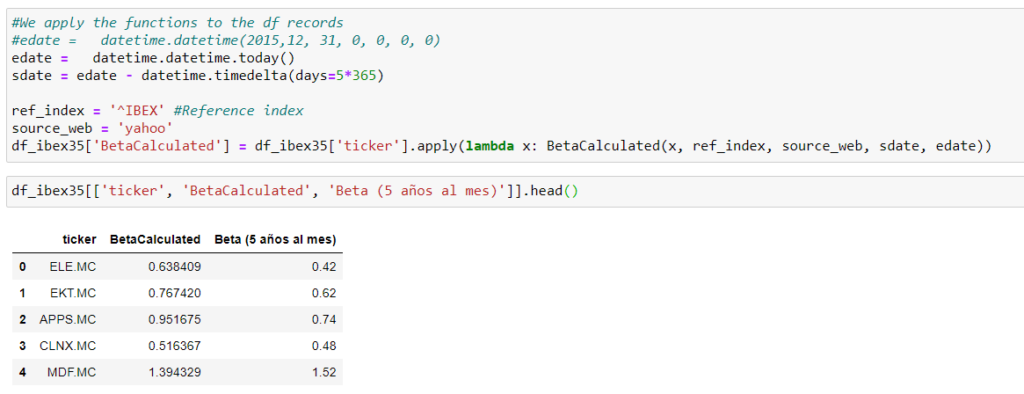
And we calculate the Beta for an updated time window for each of the companies applying the lambda function.
Conclusions
Some of the ideas we have been able to draw from the development of this work have been:
- We have seen that it is possible to calculate the beta of a company’s stocks in a specific time window that will give us the ability to check the trend of this indicator of volatility and risk of that stock against a benchmark stock index.
- We have automated the process to extract the data from yahoo finance and provide us with the result directly.
- We’ve seen how to apply it to a set of companies in a data frame.
- This beta calculation process can open the way for us to generate a simple and approximate rating model understood as a company’s credit rating and the allocation of an index representative of its level of risk, assessing its ability to meet its commitments both in the short and long term.
For more details on the jupyter notebook, you can view it in the project on Github.